
If you want to understand a protein you need to be able to visualize it, which means you need to label it. But with a lot of the tools available, attaching a label – or tag – to a protein runs the risk of disrupting how it would normally function. A group of researchers from University College London recently set out to overcome this challenge in a study looking at transmembrane AMPAR regulatory proteins (TARPs) – a group of proteins that are essential for fast excitatory transmission in the brain (1). The problem with tracking proteins like this has always been that most antibody labeling methods are too bulky to interact effectively with TARPs once they form complexes with AMPA receptors. So, the team turned to a different strategy: using α-bungarotoxin (α-BTX), a small molecule derived from snake venom, to label TARPs in living neurons.
In their study, the researchers utilized the pioneering bungarotoxin binding site (BBS)-based technique. In this technique the known minimal 13-amino acid sequence of BBS, originally found in the nicotinic ACh receptor, is incorporated into the extracellular domain of the studied membrane protein, here they inserted it into all six TARP subtypes. This small binding site allowed fluorescently tagged α-BTX to specifically bind to the TARP when it’s associated with AMPA receptors. The goal was to assess whether this labeling method could both effectively tag TARPs and maintain their normal function in the process.
Labeling TARPs with α-BTX in Live Cells
The advantage of BBS is its small size (approximately 10 kDa) when compared to antibodies (around 150 kDa), which means minimal disruption to the native function of membrane proteins. Couple this with the incredible specificity α-BTX has for the BBS and you have an excellent labelling system to use.
In this study, the researchers focused on TARP γ2, one of the best-characterized subtypes. For their first experiment they inserted human embryonic kidney (HEK) cells with BBS-tagged TARP subunits (γ2, γ3, γ4, γ6, γ7, γ8). After treating the cells with fluorescent α-BTX, they used live-cell imaging to visualize the labeled TARPs (Figure 1). The results were clear: α-BTX successfully bound to the BBS-tagged TARPs, and the fluorescent signal allowed the researchers to track their location in live cells. This was a major step forward, as it proved the BBS technique could solve the problem of labeling TARPs in their native complexes – a feat antibodies have failed to achieve.
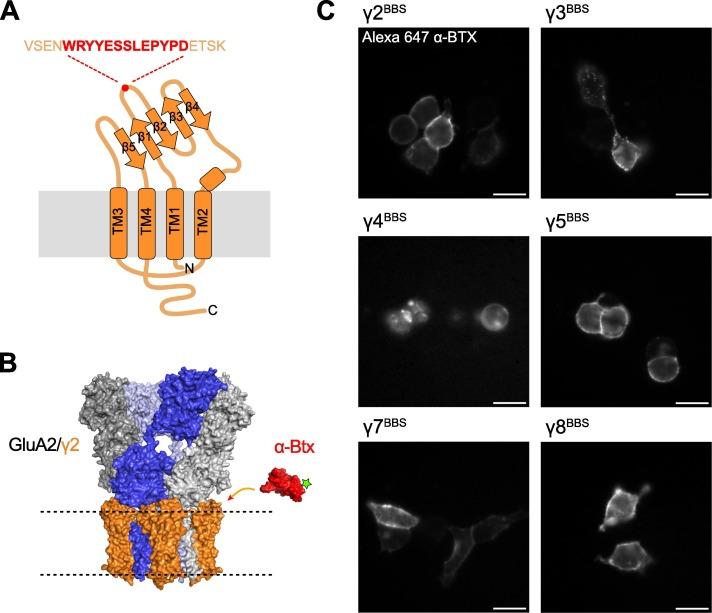
Figure 1. The insertion of a Bungarotoxin Binding Site (BBS) in the first extracellular loop (Ex1) of TARPs allow their detection with fluorescent α-Bungarotoxin (α-Btx). A, Topology of a TARP. Transmembrane helices (TM) numbered from 1 to 4. Extracellular β strands numbered from 1 to 5. The BBS (red) was inserted in the β1-β2 loop of Ex1. B, α-Btx (red, PDB:1IDI) conjugated to an Alexa Fluor molecule (green star) next to an AMPAR complex containing homomeric GluA2 and TARP γ2 (orange) (PDB:5WEO). C, Images of living HEK cells expressing BBS-tagged TARPs (γ2, γ3, γ4, γ5, γ7, γ8). Cells were labelled with Alexa 647-α-Btx. Scale bars 10 μm. Figure and legend from Bats et al. (2024) (1).
Functional Impact of BBS Tagging
Next, the team tested whether inserting the BBS into γ2 altered its functional properties when bound to AMPA receptors (Figure 2). In particular, they measured two key electrophysiological characteristics of γ2-associated AMPA receptors: their response to kainite, an AMPA receptor agonist, and their sensitivity to intracellular spermine, a polyamine that inhibits ion flow through the receptor. When γ2 associates with AMPA receptors, it enhances their response to kainite and reduces their voltage-dependent block by spermine.
In these experiments, the researchers recorded currents from HEK cells expressing GluA2 (an AMPA receptor subunit) either alone or together with γ2 or γ2 tagged with BBS. Their results were clear: both untagged γ2 and γ2 with the BBS tag enhanced kainate efficacy by about 50-fold compared to GluA2 alone. Additionally, both forms of γ2 reduced the voltage-dependent block by spermine, showing that the BBS tag did not interfere with γ2’s ability to modulate AMPA receptor function.
Furthermore, the binding of fluorescent α-BTX to the BBS-tagged γ2 had no effect on these functional properties. The AMPA receptors still responded robustly to kainate, and the block by spermine remained significantly reduced. This confirmed the BBS tagging technique preserved the physiological function of TARPs, even after fluorescent labeling.
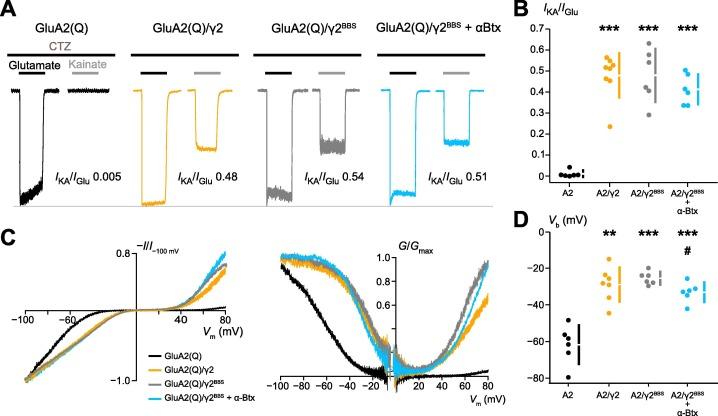
Figure 2. A, Representative outside-out patch responses from HEK293 cells transfected with GluA2(Q) (black) or GluA2(Q) co-expressed with γ2 (orange), γ2BBS (grey) or γ2BBS following a 5 min application of 25 μg/ml Alexa 647α-Btx (cyan). 200 ms applications of 10 mM glutamate (black bars) and 50 μM kainate (gray bars), in the presence of 50 μM cyclothiazide are shown – note the appreciable response to kainate for all γ2 conditions. B, Plot displaying IKA/IGlu ratios for the four conditions. Filled circles are data from individual experiments and the gapped lines indicate means and standard deviations. C, Left, representative current–voltage (I-V) relationships obtained from application of voltage ramps (−100 to +80 mV, 100 mV/s) in the presence of glutamate and cyclothiazide – note the reduction in spermine-induced rectification for all γ2 conditions. Right, conductance-voltage (G-V) relationships from the same records. D, Plot of Vb (the voltage of half-block of inward currents) from fits of individual I-V relationships with a double Boltzmann function, displayed as in B. In C and D asterisks denote comparisons against GluA2(Q) alone (** p < 0.01, *** p < 0.001). Hash denotes comparison against γ2BBS (# p < 0.05). Figure and legend from Bats et al. (2024) (1).
Synaptic Localization of Labeled TARPs
The researchers then moved on to neurons to test whether their labeling technique could visualize TARPs in a more physiologically relevant system (Figure 3). They focused on cerebellar stellate cells from stargazer mice, which naturally lack γ2 and demonstrate AMPA receptors synaptic clustering in the absence of TARP. In neurons, γ2 binds AMPA receptors indirectly, through PSD-95 and labeling TARPs with α-BTX will not provide direct evidence for AMPA receptors dynamics. Therefore, they designed a BBS-tagged γ2 construct lacking the PSD-95 binding motif (ΔPBM) to avoid γ2-PSD-95 interaction. After transfecting stargazer neurons with the BBS-tagged γ2(ΔPBM), the team treated the neurons with fluorescent α-BTX and imaged the cells. The results showed that γ2(ΔPBM), when tagged with BBS, trafficked to synapses where it co-localizes directly with AMPA receptors. This was a key finding, as it demonstrated that the BBS-tagging method allows researchers to visualize not only TARP surface expression but also their synaptic localization in living neurons.
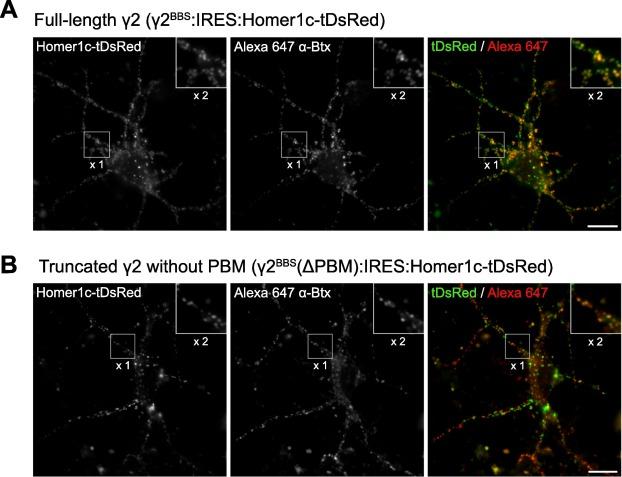
Figure 3. A, Example of Alexa 647-α-Btx (red in the overlay) synaptic labelling in stargazer cerebellar stellate cells transfected with γ2BBS:IRES:Homer1C-tDsRed. Synapses were identified using Homer1c-tDsRed (green in the overlay). Magnification of a selected region (inset at the top right corner of images) illustrates the colocalization of the fluorescent signals. Scale bar 50 μm. B, Same as in A, but for neurons transfected with γ2BBS(ΔPDZ):IRES:Homer1C-tDsRed. Scale bar 50 μm. Figure and legend from Bats et al. (2024) (1).
Conclusion
It’s clear from this work that you can use this BBS tagging method to not only visualize TARP dynamics at the cell surface but do so without disrupting protein function.
As invaluable as antibodies have been – and will continue to be – they’re not without limitations due to their sheer size and potential specificity issues. But with BBS and fluorescent α-BTX you can bypass some of these limitations, open the door to real-time imaging of receptor dynamics in live cells, and uncover new insights into the behavior of a multitude of other receptors.
Fluorescently labeled α-Bungarotoxin
We’ve developed a number of α-BTX molecules labeled with different fluorophores. These are all developed in house and validated in multiple bioassays.
Find the one that best suits your experiments:
| α-Bungarotoxin-ATTO Fluor-647N (#B-100-FRN) |
| α-Bungarotoxin-ATTO Fluor-488 (#B-100-AG) |
| α-Bungarotoxin-ATTO Fluor-633 (#B-100-FR) |
| α-Bungarotoxin-FITC (#B-100-F) |
| α-Bungarotoxin-Biotin (#B-100-B) |
Reference
1. C. Bats, I. D. Coombs, M. Farrant, S. G. Cull-Candy, α-Bungarotoxin labelling of AMPA receptor-associated TARPs in living neurons. Neuroscience, S0306-4522(24)00440–8 (2024). DOI: https://doi.org/10.1016/j.neuroscience.2024.08.036.